How to monitor CPU utilization in Linux
Published on 2020-10-16, by Javed Shaikh
Monitoring CPU utilization is one of the very important tasks of a back-end system engineer. CPU utilization is nothing but the total works or tasks being processed by your central processing unit or CPU. Its always a good practice for every developer to know the common utilities to monitor cpu utilization of the system they are working.
In windows we use Task manager to check the statistical performance of CPU, memory ,disk network.. But what about Linux operating system. Lets check it out.
We will go through these utilities one by one.
- top
- htop
- nmon
- vmstat
top
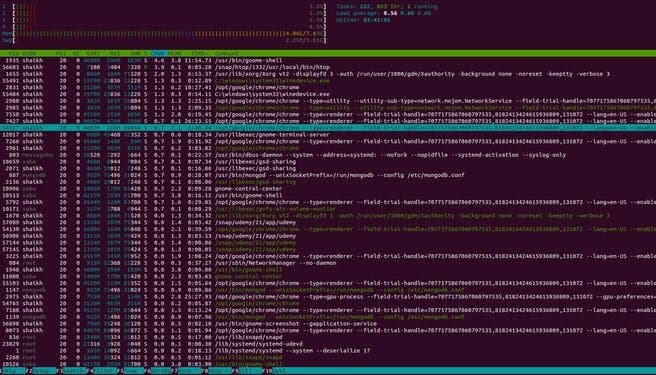
top is one of the oldest command or utility to monitor system performance. It is a built in utility for any Linux operating system. It will display information like no of tasks, no of users, cpu utilization, statistical data about memory usage and list of active processes.
Just input top and enter
shaikh@shaikhu-com:~$ tophere is the output of the top command
top - 11:23:33 up  3:11,  2 users,  load average: 0.86, 0.69, 1.01
Tasks: 317 total,   2 running, 315 sleeping,   0 stopped,   0 zombie
%Cpu(s): 34.6 us,  9.5 sy,  0.0 ni, 55.0 id,  0.0 wa,  0.0 hi,  0.8 si,  0.0 st
MiB Mem :   7814.9 total,    938.9 free,   2650.3 used,   4225.7 buff/cache
MiB Swap:   3906.0 total,   3906.0 free,      0.0 used.   3753.6 avail Mem
    PID USER      PR  NI    VIRT    RES    SHR S  %CPU  %MEM     TIME+ COMMAND
  7427 shaikh    20   0 9309320 483092 306628 S  65.7   6.0  24:12.65 chrome
   1935 shaikh    20   0 4556040 288016 108556 S  17.6   3.6  10:12.54 gnome-shell
   1655 shaikh    20   0  843820  76204  41576 S  10.8   1.0   5:44.07 Xorg
   2831 shaikh    20   0 1574816 502964 363492 S   8.2   6.3   9:03.78 chrome
   1572 shaikh     9 -11 2539652  19556  15264 S   7.2   0.2   2:08.94 pulseaudio
Now there are few quick commands available for top utility like press below keys for respective output on top command screen
- k to kill a process. It will ask for process id or pid to kill
- p to display processes based on cpu usage
- m to display list of processes based on memory usage
- q to quit
htop
htop is another realtime cpu performance monitoring tool and is almost similar to top command but with expanded screen. It is more user friendly and will give better viewing experience than top. You may need to install this utility using below command for ubuntu os
shaikh@shaikhu-com:~$ sudo snap install htopLets take a look
shaikh@shaikhu-com:~$ htopHere is the output of htop

nmon
nmon is system admin tool to monitor performance of a Linux operating system. This is developed by IBM's Nigel Griffiths and the name nmon is a short hand for Nigel's Monitor. It has nice colorful screen with many different statistical views.
First lets install this utility using below command
shaikh@shaikhu-com:~$ sudo apt-get install nmonlets start it, type nmon and enter
shaikh@shaikhu-com:~$ nmonYou will see below menu screen for nmon
│   ------------------------------                                                                                                                                                                        │
│    _ __  _ __ ___   ___  _ __          For help type H or ...                                                                                                                                           │
│   | '_ \| '_ ` _ \ / _ \| '_ \          nmon -?  - hint                                                                                                                                                 │
│   | | | | | | | | | (_) | | | |         nmon -h  - full details                                                                                                                                         │
│   |_| |_|_| |_| |_|\___/|_| |_|                                                                                                                                                                         │
│                                        To stop nmon type q to Quit                                                                                                                                      │
│   ------------------------------                                                                                                                                                                        │
│                                                                                                                                                                                                         │
│   Use these keys to toggle statistics on/off:                                                                                                                                                           │
│     c = CPU         l = CPU Long-term     - = Faster screen updates                                                                                                                                     │
│     C = " WideView  U = Utilisation       + = Slower screen updates                                                                                                                                     │
│     m = Memory      V = Virtual memory    j = File Systems                                                                                                                                              │
│     d = Disks       n = Network           . = only busy disks/procs                                                                                                                                     │
│     r = Resource    N = NFS               h = more options                                                                                                                                              │
│     k = Kernel      t = Top-processes     q = Quit                                                                                                                                                      │
vmstat
This command can be used to display information about system processes, memory, swap, disk and cpu usage
Lets type vmstat and enter
shaikh@shaikhu-com:~$ vmstat
procs -----------memory---------- ---swap-- -----io---- -system-- ------cpu-----
 r  b   swpd   free   buff  cache   si   so    bi    bo   in   cs us sy id wa st
 0  0  10240 645752 313692 3789356    0    0    55    66  493  109 18  5 76  0  0
If you want to display vmstat for every 2 seconds, use below command
shaikh@shaikhu-com:~$ vmstat 2The above command will display system status every 2 seconds unless you interrupt it. Lets take another example
shaikh@shaikhu-com:~$ vmstat 5 10
procs -----------memory---------- ---swap-- -----io---- -system-- ------cpu-----
 r  b   swpd   free   buff  cache   si   so    bi    bo   in   cs us sy id wa st
 0  0  10240 512428 315012 3869748    0    0    52    65  487  154 18  5 77  0  0
 0  0  10240 512428 315020 3869588    0    0     0    45  396  738  2  1 98  0  0
 0  0  10240 481684 315028 3900856    0    0     0     7  726 1153  3  1 96  0  0
 0  0  10240 467320 315036 3914636    0    0     0    37  743 1730  6  2 92  0  0
 1  0  10240 486756 315052 3894072    0    0     0    90  694 1586  5  2 93  0  0
 0  0  10240 494316 315064 3887496    0    0     0    12  592 1264  3  1 95  0  0
 0  0  10240 500900 315072 3879552    0    0     0     9  623 1461  5  1 94  0  0
 0  0  10240 505200 315072 3874556    0    0     0    30  893 2205  8  2 90  0  0
 0  0  10240 474204 315080 3906004    0    0     0   156  971 2396  8  3 89  0  0
 0  0  10240 469416 315088 3910568    0    0     0    14  920 2261  8  2 89  0  0
The above command will display system status every 5 seconds for 10 times
Conclusion
Knowing and practicing above commands can help troubleshoot any process and performance related issue.
I know there are many more utilities out there including iostat,sar,mpstat.. and what not 😊 but I have been using these four for most of the times to keep an eye on the system. Out of these, nmon and top are my favorite utility to check the system usage data and manage the processes accordingly. Let me know which utility you have been using to monitor system health.
Related articles ...
How to manage background processes in Linux
If you are new to Linux operating system and you start a command or process using terminal/session, you must have noticed that you need to wait till a process or command get finished before starting another command.
2020-10-18
How to schedule and manage tasks using crontab
Crontab is short form of cron table. The cron is a utility available on all Linux and Unix operating system that runs a task or process at a given date and time.
2020-10-15